How to Run an AI Hiring Bias Audit: A 6-Step Process
 Regine CyrilleHuman Resource21 Aug 2026
A bias audit is usually treated as a document you obtain. Someone asks whether the screening tool has been audited, a PDF is produced, the question is answered, and the file goes into a folder until the following year.
The difficulty is that the same underlying data can produce an audit that passes and an audit that fails, depending on choices made before anyone calculates anything. How you group the roles, how you handle applicants who declined to state their ethnicity, whether you look at each stage or only the outcome. Each of those decisions moves the result, and none of them appear in the summary.
An audit is not a measurement you take. It is a set of methodological choices you make, and then a measurement.
Why do most published audits show no problem?
Because most of them are structured in ways that make problems hard to see. Two independent findings in the last two years make this concrete.
Stanford researchers analyzed roughly four million applications across 156 employers and 1,746 individual job positions, all processed by a single screening vendor. The vendor's own audits, which pooled applicants across employers and roles, had shown minimal adverse impact. Analyzing each position separately produced clear racial disparities. Thirty percent of Black applicants had applied to at least one position violating the four-fifths rule. The paper's own summary of the mechanism is blunt: aggregating from individual positions to occupation groups suffices to mask the per-position adverse impact.
Separately, an ACLU-led team examined 116 audits across 44 published reports. Eighty-three percent reported missing race or sex data for some applicants, and when the researchers recomputed the impact ratios as ranges that accounted for that missing data, 70% had a plausible lower bound below 0.8, despite the published figures sitting comfortably above it.
Two different methodological choices, both capable of reversing the headline. The six steps below are ordered so that you make those choices deliberately.
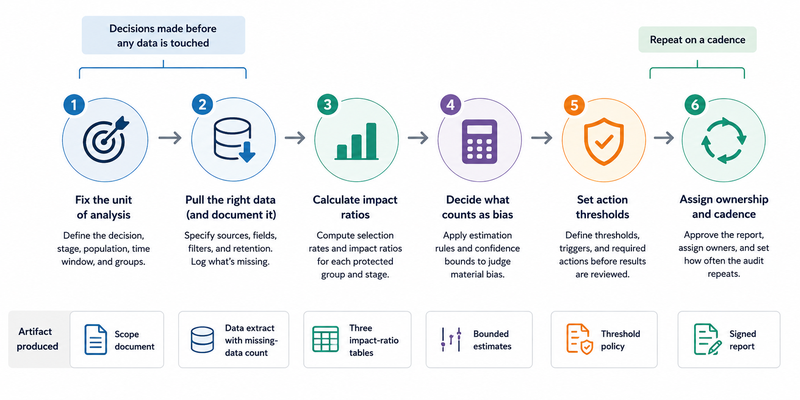
1. Fix the unit of analysis before you pull a single row
Decide now whether you are auditing the tool, the tool as configured for one job family, or each requisition separately. This decision determines the answer more than any other.
Position-level is the defensible default, because it matches how discrimination law is actually applied: a claim is brought about a role, not about a vendor's global average. It is also harder, because it produces many small samples, which is the subject of step four.
Where you genuinely cannot analyze position by position, group roles that share a rubric and a cutoff, and write down the grouping rule before you see any results. A grouping chosen after the fact is not a methodology, it is an outcome.
Takeaway: write the unit of analysis into the audit scope document and date it. If it changes later, the reason belongs in the report.
2. Pull stage-by-stage outcomes, and count what is missing
You need, for every applicant in the period: self-identified sex and race or ethnicity, the outcome at each decision point, and the score or rating the tool produced. Stage by stage, not just hired or not, because an end-to-end ratio can look fine while one stage inside it is doing all the filtering.
Then count the gaps honestly, because they will be larger than you expect. One major vendor's published audit excluded roughly 76% of records for unknown gender and around 85% for unknown race or ethnicity. That is not unusual. It is closer to typical.
One rule matters more than any other here. New York City's guidance is explicit that imputed or inferred data cannot be used to conduct a bias audit. Surname and geography-based inference is off the table. You use what candidates told you, or you report the gap.
Takeaway: report the missing-data rate on the first page, not in a footnote. An audit covering 15% of applicants is a different document from one covering 90%.
3. Calculate selection rates and impact ratios, including intersectional
The mechanics are older than the technology. The Uniform Guidelines on Employee Selection Procedures state that a selection rate for any race, sex or ethnic group below four-fifths of the rate for the highest group will generally be regarded as evidence of adverse impact.
Selection rate is the share of a group advanced by the tool. Impact ratio is that group's rate divided by the highest group's rate. Where a tool scores rather than selects, the equivalent is the scoring rate, meaning the share of a group scoring above the median.
Run three sets: sex, race and ethnicity across the standard categories, and the intersections of the two. The intersectional cut is not optional under New York City's rules and it is where disparity most often appears. A tool can look acceptable for women and acceptable for Black applicants while producing a clear gap for Black women.
Takeaway: if your audit has two tables instead of three, the missing one is intersectional, and it is the one most likely to contain the finding.
4. Handle small samples and missing data explicitly
The four-fifths rule misbehaves at low numbers, and the Uniform Guidelines say so themselves. The same paragraph notes that greater differences may not constitute adverse impact where they are based on small numbers and are not statistically significant, and that smaller differences may still constitute it where they are significant.
Set a floor and publish it. A common working definition treats a group as too small to report when it is under 2% of the applicant pool or fewer than 30 individuals. Below that, flag the cell rather than deleting it, and state the count.
Then follow the recommendation the ACLU team made after reviewing all those audits: report ranges rather than point estimates where demographic data is missing. Calculate the impact ratio under the most and least favorable assumptions about the unknown group. If the range crosses 0.8, your audit has not cleared the tool. It has failed to reach a conclusion, which is a different and more honest finding.
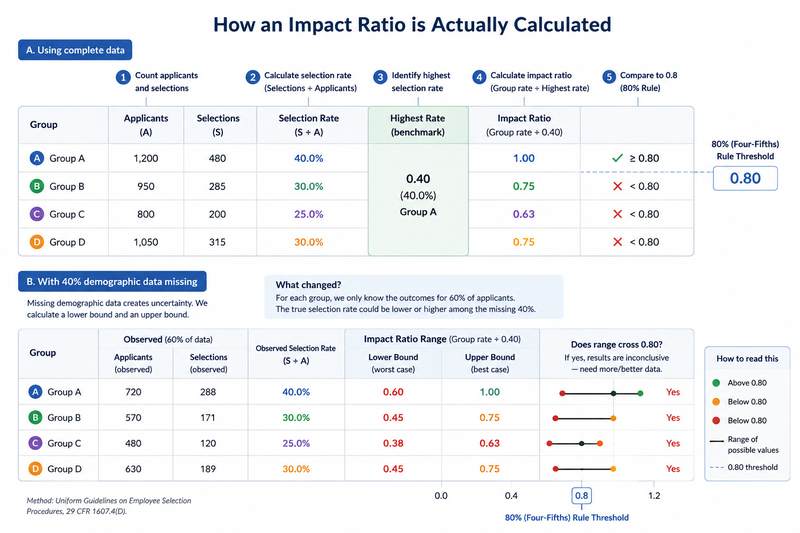
Takeaway: an impact ratio of 0.86 with 80% of the data missing is not a pass. Publish the bound alongside the estimate.
5. Decide what triggers action before you see the numbers
Write the thresholds first, while nobody has a stake in where they sit. Below 0.8 with an adequate sample triggers remediation. Between 0.8 and 0.9, or below 0.8 with a small sample, triggers a significance test and a documented review. Above 0.9 is recorded and revisited next cycle.
A statistical finding is a warning light rather than a verdict. What follows is a business necessity assessment, meaning can you show the criterion is job-related, and then, critically, a search for a less discriminatory alternative. As the ABA's Business Law Today notes, failure to adopt a less discriminatory algorithm that was considered during the design process may itself create liability, and employers cannot rely on a vendor's own assessment of its tool's impact.
Remediation is usually mundane: move a cutoff, drop a feature, change the job family the tool is applied to, or stop using it for that role. Rewriting the model is rarely the fastest available fix.
Takeaway: thresholds written after the results are advocacy. Agree them in the scoping meeting and put them in the same document as the scope.
6. Assign ownership, cadence and privilege
Someone has to sign it. Name them before you start, usually the person accountable for the hiring process rather than the person who bought the tool, because those are different people with different incentives.
On independence: there is no license, no register and no approval process for bias auditors. New York City's own guidance confirms that auditors need no city approval, and in practice the market is concentrated. A census of published audits found three firms accounting for over half of them, and one auditor that had never published an audit characterized as failed. Independence is a condition you have to check, not a credential you can look up.
Annual is the regulatory floor where it applies, and it is the wrong cadence for a tool you have just reconfigured. Re-run whenever the model is retrained, the cutoff moves, or you apply the tool to a new job family. Scope the work through counsel from the outset if you want the analysis privileged, because that decision cannot be made retroactively.
Takeaway: put the re-audit trigger in your change process, not your calendar. Configuration changes are what invalidate the last one.
Where to Start
Pull the last twelve months of applicant data for your single highest-volume role and calculate one thing: the selection rate for each group at each stage. Not the whole audit. One role, one table.
Two things usually fall out of that afternoon. The first is the state of your demographic data, which is the binding constraint on everything else and takes months to improve. The second is whether the filtering happens where you assumed it did. Teams routinely discover that a stage they consider administrative is removing more people than the assessment they were worried about.
That single table also tells you what a full audit will cost and whether your data can support one. It is a better first step than commissioning a report you cannot yet interpret, and it is the same work either way.
Latest From Our Blog
Discover fresh insights, trends, and tips on tech talent and offshore development. Stay informed with our latest updates